- Node-RED and Pi-Plates - Getting Started
- Node-RED and Pi-Plates - Adding a Dashboard
In the first lesson of this series, we learned how to:
- Install Node-RED on the RPi
- Access the Node-RED editor with both locally and remotely with a browser
- Add a new palette
- Create a simple flow
In this lesson we will learn how to add and view a simple dashboard.
First, let's return to the flow we created in the last lesson:

As you can see, we have a simple flow that reads an analog input on a DAQC2plate and displays the value once a second. And, while functional, Node-RED has tools that will allow us to display the data in a number of more interesting ways. To begin, let's click on the “hamburger” on the upper right corner of the screen again followed by a click on “Manage palette” in the dropdown menu:

This will bring up the Palette tab in the Users Settings. Click on the "Install" tab at the top and then enter the word "dashboard" into the search field. Scroll down until you find "node-red-dashboard" and click the install button (ours was already installed):
After the dashboard palette is installed, scroll down on the list of nodes located on the left of the screen untill you find the dashboard selections:
Next, drag a gauge node to the right of the analog input node and create a connection:

Double click the gauge node and change the settings to match the ones shown below:

When you have finished, your flow should look like this:

Now, click the Deploy button on the upper right of the screen followed by opening a new browser tab. In the address of your new tab, type in the ip address and port of the of the Raspberry Pi followed by the characters "/ui". On my setup this looks like: http://192.168.4.113:1880/ui. After you press ENTER, you should see a gauge that will look something like this:
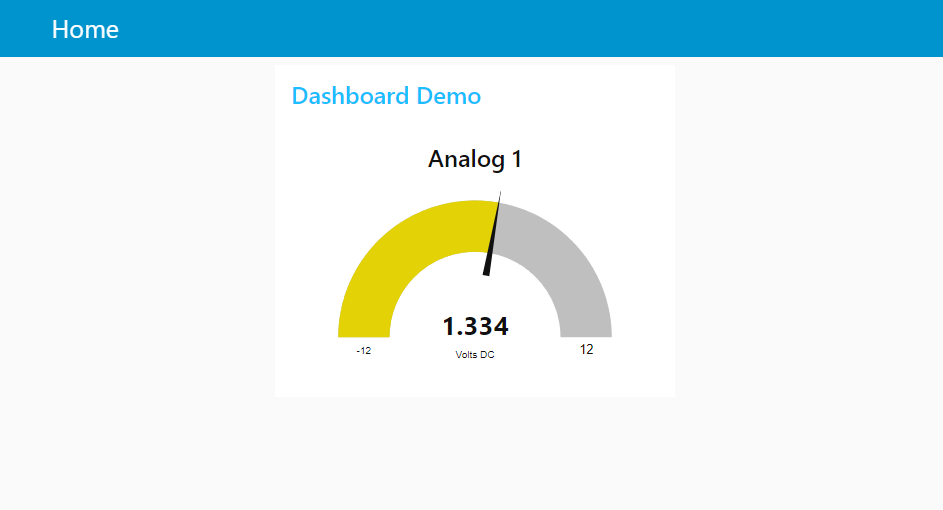
Pretty neat, right? As the input voltage of Analog input 1 swings from -12 to +12, the color behind the needle will change from green to yellow and then to red. Experiment with the colors on the gauge to suit your tastes.
So far, we jave just scratched the surface of what can be done with the dashboard nodes and we'll cover some of that in the next lesson.
That concludes this lesson where you:
- Installed the dashboard palette
- Added a gauge node
- Viewed the dashboard in a dedicated browser window.
Until next time, feel free to experiment with some of the other nodes that are available for the dashboard.