Introduction
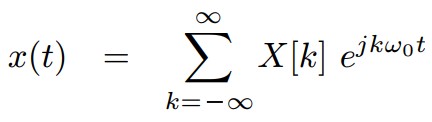
Any periodic signal can be converted into a series of sine waves. For example, a simple square wave can be represented by the Fourier series:
 The red lines in the diagram below show the square wave (blue) being reconstructed with the first 4 terms of this series:

A spectrum analyzer is an instrument that finds all of the sine waves in a periodic waveform and plots them by frequency:![]()
Spectrum analysis is used in a wide variety of applications including evaluating amplifier performance, radio telescopes, and monitoring motor vibrations to name just a few.
Implementation
With a 24bits of resolution, a low noise floor, and sample rates as high as 31.25Khz, the Pi-Plates ADCplate makes an ideal Analog to Digital converter for a spectrum analyzer. Combining this with the computational speed and graphical user interface provided by the Raspberry Pi gives us a high quality Spectrum Analyzer that is suitable for signals from DC to 15.625Khz.
The signal flow for this spectrum analyzer application is:
- Initialize all variables and Tkinter GUI components
- Once every second:
- Read a block of 2048 values from the ADCplate using the current sample rate
- Apply selected window function to data sequence
- Apply the Numpy Fast Fourier Transform to the samples
- Discard the last 1024 returned values since they mirror the first 1024 values
- Calculate the amplitudes of these values (the numbers are complex) and convert to dB
- Apply running average using selected count
- Plot the data to the canvas area on the GUI
Installation
Perform the following steps to install the ADCplate Spectrum Analyzer script to your Raspberry Pi:
- Ensure that there is an ADCplate on your stack and that you have version 9.1 of the Pi-Plates Python modules installed
- Download the spectrum analyzers files from our server with: sudo wget https://pi-plates.com/downloads/SpectAnalyzer.tar.gz
- Then decompress them into your home directory with: tar -xvPf SpectAnalyzer.tar.gz (for the Bookworm OS, you will have to do the these steps inside of a virtual environment)
- Change to the Applications folder with: cd Applications
- Open a terminal window and launch the program with: python SpectAnalyzer.py
- Alternatively, you can click the newly created icon on your desktop labeled "SpectrumAnalyzer"
Controls
The GUI and its controls is shown below:

The various options include:
- Frequency Span - selects the sample rate of the ADCplate and changes to X-axis to reflect the sample rate divided by 2.
- Window Function - these functions are used to clean up the data before passing it to the FFT. Their main effect are to remove broad spectral artifacts, better isolate the primary spectral components, and to lower the lower the noise floor. The different window types provided perform different levels of each of those enhancements. We have found that the Hanning Window gives good overall performance
- ADC Input Selection - this one is pretty self explanatory. If you are concerned about 60Hz interference then place your signal on the D0-D3 inputs.
- Scan Averaging - This selects the number of scans to average together before being displayed. This reduces the displayed noise levels and allows smaller spectral lines to be identified. Note that changing the frequency span or the input will reset the the average output to 0 and will require n scans before settling down again. We usually select 8 averages.
- ADCplate Address Selection - this chooses the address of the board your are monitoring in the event that you have more than one on the stack.
Application - the Search For a Clean Sine Wave
When the ADCplate was being developed, we realized the need to verify that our design was not adding harmonics to the incoming signal. To do this would require a pure 1,000Hz sine wave generator that was so pure, it would generate a single line on the spectrum analyzer. At the time we thought, "how hard can that be?"
DAQC2plate
First, we started by using the sine wave generated by a DAQC2plate. This generator works by writing a 12-bit number from a look-up table to a DAC output at 200Khz. While this sine wave looks acceptable on an oscilloscope, it's not very pretty on the spectrum analyzer:

DDS Signal Generator
We then fired up our economy DDS (Direct Digital Synthesis) function generator and looked at a 1Vrms sine wave - it was even worse! Look at all of those even and odd harmonics at 2, 3, 4, and 5Khz.

Wien Bridge Oscillator - a Bill and Dave Classic
Finally, we went back and revisited a design idea from the two guys who pretty much invented Silicon Valley - Hewlett and Packard. Their first product, the HP200B, was designed around a Wien Bridge Oscillator. Their invention was to stabilize the signal of this oscillator using incandescent light bulbs in the feedback path. We did a search online for a modern equivalent and found a promising design here: https://www.barbouri.com/2019/08/28/wien-bridge-oscillator-design/ Just like Bill and Dave's design, this oscillator uses two incandescent bulbs in the feedback path for stability.
After we purchased the parts and assembled the board, we turn it on, and looked at the output with our Spectrum Analyzer:

While the above looks -pretty- good, we were able to improve it by reducing the feedback gain until all the harmonics disappeared. And that, pretty much gave us the "pure" 1Khz sine wave we were looking for:

Wrapup
That wraps up the documentation of the ADCplate Spectrum Analyzer application. Hopefully you will find it useful as a standalone tool, as a means of understanding the FFT, or as a springboard for your own application. There are plenty of improvements that can be made such as making the vertical scale accurate and absolute for each window mode (it's currently only accurate with no window where 0dB = 1Vrms), or adding an XY cursor for reading data directly from the screen.